Ben Tice

Enron Network and Linguistics Analysis
Enron was an American energy company that went bankrupt in 2001. It was later revealed that the financial condition was sustained by institionalized, systematic, and creatively planned accounting fraud. The Enron scandal, as it is now known, lead to the release of the Enron email corpus which was acquired by the Federal Energy Regulatory Commission during its investigation of the company’s collapse. The corpus is unique as the only publicly available mass collection of real emails easily available for use in network analysis and machine learning.
In a series of studies Pennebaker found that lower status individuals used more first-person singular pronouns (I) compared with higher status individuals. In addition, he found that lower status individuals used first-person plural (we) more relative to lower status individuals. This was tested using various centrality algorithms (degree, closeness, & betweenness) common in Network Theory as a indicators of importance and status in a social network.
import numpy as np
import email
import pandas as pd
import matplotlib.pyplot as plt
import seaborn as sns
import networkx as nx
import holoviews as hv
import datashader as ds
hv.extension('bokeh')
# creates a dataframe of edges and their weights
pd_edges = email_exchanges[['From', 'To']]
pd_edges['weight'] = 1
pd_edges[['From', 'To', 'weight']]\
.groupby(['From', 'To'])\
.count()\
.reset_index()\
.head(15)
| From | To | weight | |
|---|---|---|---|
| 0 | (phillip.allen@enron.com) | (tim.belden@enron.com) | 8 |
| 1 | (phillip.allen@enron.com) | (brent.price@enron.com) | 1 |
| 2 | (phillip.allen@enron.com) | (steve.jackson@enron.com) | 1 |
| 3 | (phillip.allen@enron.com) | (jeffrey.gossett@enron.com) | 1 |
| 4 | (phillip.allen@enron.com) | (thomas.martin@enron.com) | 1 |
| 5 | (phillip.allen@enron.com) | (sally.beck@enron.com) | 1 |
| 6 | (phillip.allen@enron.com) | (susan.mara@enron.com) | 1 |
| 7 | (phillip.allen@enron.com) | (john.arnold@enron.com) | 1 |
| 8 | (phillip.allen@enron.com) | (matt.smith@enron.com) | 3 |
| 9 | (phillip.allen@enron.com) | (rebecca.cantrell@enron.com) | 1 |
| 10 | (phillip.allen@enron.com) | (scott.neal@enron.com) | 1 |
| 11 | (phillip.allen@enron.com) | (kevin.mcgowan@enron.com) | 1 |
| 12 | (phillip.allen@enron.com) | (ywang@enron.com) | 2 |
| 13 | (phillip.allen@enron.com) | (al.pollard@enron.com) | 5 |
| 14 | (phillip.allen@enron.com) | (paul.lucci@enron.com) | 1 |
# creates a directed graph and adds weighted edges to it
G = nx.DiGraph()
G.add_weighted_edges_from(gma)
G.remove_edges_from(nx.selfloop_edges(G))
# will create a basic visualization of the network in a spring layout
spring_pos = nx.spring_layout(G)
plt.figure(figsize=(10, 10))
plt.axis("off")
nx.draw_networkx(G,
                 pos= spring_pos,
                 with_labels=False,
                 node_size=1,
                 arrows=False,
                 widths=0.4)
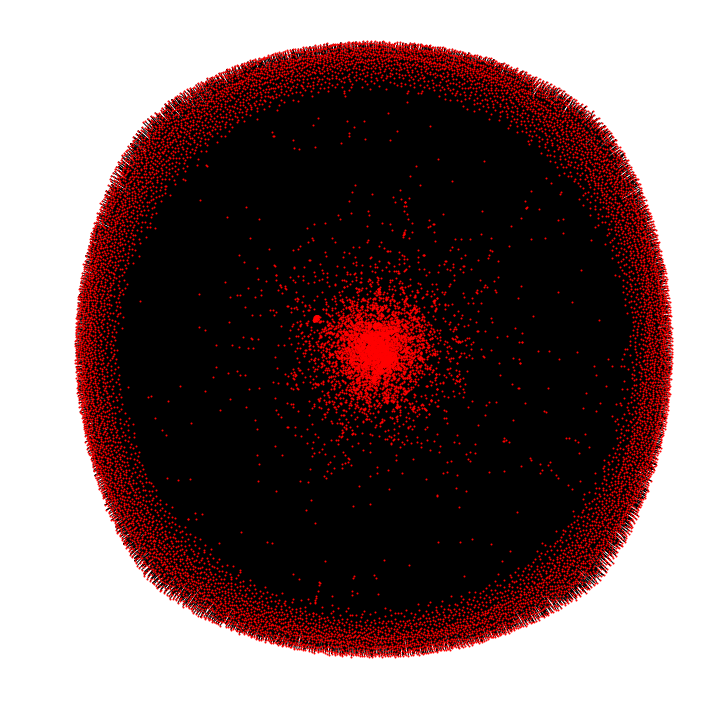
This layout was drawn with Force-Directed Graph Algorithm. These used ‘weight’ which corresponded to the number of emails sent between nodes. The more emails exchanged the closer nodes were brought together.
This basic drawing of the network is a birds-eye-view of the hierarchy. Executives and important employees would be at the center of the ring with many connections amongst each other and to the outer nodes.
Hierarchy and Centrality Indicators
If centrality indicators are going to be a good measure of hierarchy within a network it would have a high number of Enron Executives rated as most central. Here are some executives to watch out for:
Kenneth Lay CEO and later Chairman
Jeff Skilling CEO
Greg Whalley President
Sally.Beck COO
Steven Kean Vice President and Chief of Staff
Jeff Dasovich Government Relation Executive
John Lavorato CEO of Enron America
Louise Kitchen President of Enron Online
Degree Centrality is the measurement of total nodes that the node is connected to vs total nodes in the network.
In Enron’s case those that communicate often with more people compared to the number of people in the Enron Network overall. Degree Centrality has previously shown to be 83% accurate in predicting organizational dominance with the enron network using their titles to deduce the organizational hierarchy (Agarwal, Omuya, Harnly, Rambow, 2012). In degree centrality notes how many different nodes any given node is connected to based communications towards them. This is important as mass emails might not confer dominance but rather a communications role. We will look at in and out degree contrasted as well.
incent = nx.in_degree_centrality(G)
Algorithm = 'in_degree'
e_centrality = pd.DataFrame(list(incent.items()), columns=['Emails', Algorithm])
Email_Centrality = pd.DataFrame(list(incent.items()), columns=['Emails', Algorithm])
e_centrality.sort_values(Algorithm, ascending=False).head(15)
| Emails | in_degree | |
|---|---|---|
| 443 | (louise.kitchen@enron.com) | 0.035435 |
| 6 | (sally.beck@enron.com) | 0.029468 |
| 43 | (john.lavorato@enron.com) | 0.028361 |
| 360 | (tana.jones@enron.com) | 0.026269 |
| 361 | (sara.shackleton@enron.com) | 0.025715 |
| 2288 | (kenneth.lay@enron.com) | 0.025161 |
| 180 | (jeff.skilling@enron.com) | 0.022701 |
| 392 | (greg.whalley@enron.com) | 0.022147 |
| 515 | (mark.taylor@enron.com) | 0.021593 |
| 444 | (vince.kaminski@enron.com) | 0.021470 |
| 72 | (steven.kean@enron.com) | 0.021163 |
| 81 | (jeff.dasovich@enron.com) | 0.020178 |
| 125 | (gerald.nemec@enron.com) | 0.019317 |
| 118 | (richard.shapiro@enron.com) | 0.019010 |
| 200 | (rod.hayslett@enron.com) | 0.017964 |
outcent = nx.out_degree_centrality(G)
Algorithm = 'out_degree'
e_centrality = pd.DataFrame(list(outcent.items()), columns=['Emails', Algorithm])
Email_Centrality = Email_Centrality.merge(e_centrality, on='Emails')
e_centrality.sort_values(Algorithm, ascending=False).head(15)
| Emails | out_degree | |
|---|---|---|
| 81 | (jeff.dasovich@enron.com) | 0.038265 |
| 360 | (tana.jones@enron.com) | 0.036235 |
| 361 | (sara.shackleton@enron.com) | 0.031006 |
| 6 | (sally.beck@enron.com) | 0.029222 |
| 444 | (vince.kaminski@enron.com) | 0.026515 |
| 443 | (louise.kitchen@enron.com) | 0.025531 |
| 1064 | (chris.germany@enron.com) | 0.023377 |
| 150 | (kay.mann@enron.com) | 0.022455 |
| 125 | (gerald.nemec@enron.com) | 0.021839 |
| 108 | (susan.scott@enron.com) | 0.020855 |
| 515 | (mark.taylor@enron.com) | 0.020424 |
| 3742 | (michelle.cash@enron.com) | 0.020178 |
| 5517 | (transportation.parking@enron.com) | 0.019932 |
| 347 | (janette.elbertson@enron.com) | 0.019133 |
| 503 | (d..steffes@enron.com) | 0.018210 |
Closeness Centrality This captures how close a node is to any given node in the network. We would expect executives to be high up on this measure.
For instance, low-level Enron employees in California will be very far from low-level employees in Europe. While executive management should have high closeness centrality because they can reach many nodes down the chain of command.
close_cent = nx.closeness_centrality(G)
Algorithm = 'closeness'
e_centrality = pd.DataFrame(list(close_cent.items()), columns=['Emails', Algorithm])
Email_Centrality = Email_Centrality.merge(e_centrality, on='Emails')
e_centrality.sort_values(Algorithm, ascending=False).head(15)
| Emails | closeness | |
|---|---|---|
| 443 | (louise.kitchen@enron.com) | 0.160202 |
| 43 | (john.lavorato@enron.com) | 0.152906 |
| 392 | (greg.whalley@enron.com) | 0.152086 |
| 6 | (sally.beck@enron.com) | 0.150729 |
| 2288 | (kenneth.lay@enron.com) | 0.149302 |
| 72 | (steven.kean@enron.com) | 0.148169 |
| 1 | (tim.belden@enron.com) | 0.146850 |
| 444 | (vince.kaminski@enron.com) | 0.146255 |
| 180 | (jeff.skilling@enron.com) | 0.145934 |
| 49 | (david.delainey@enron.com) | 0.145595 |
| 515 | (mark.taylor@enron.com) | 0.145426 |
| 360 | (tana.jones@enron.com) | 0.143843 |
| 1564 | (janet.dietrich@enron.com) | 0.143591 |
| 11 | (scott.neal@enron.com) | 0.143426 |
| 274 | (m..presto@enron.com) | 0.143262 |
Betweenness Centrality Quantifies how many times a node acts as the shortest path between two nodes.
For our purposes, betweenness centrality should show management roles. Managers will often be the shortest path to other management and other departments. Some employees will communicate with their managers more than they will communicate with people from other departments.
betcent = nx.betweenness_centrality(G)
Algorithm = 'betweenness'
e_centrality = pd.DataFrame(list(betcent.items()), columns=['Emails', Algorithm])
Email_Centrality = Email_Centrality.merge(e_centrality, on='Emails')
e_centrality.sort_values(Algorithm, ascending=False).head(15)
| Emails | betweenness | |
|---|---|---|
| 6 | (sally.beck@enron.com) | 0.020167 |
| 443 | (louise.kitchen@enron.com) | 0.018188 |
| 81 | (jeff.dasovich@enron.com) | 0.018057 |
| 444 | (vince.kaminski@enron.com) | 0.017002 |
| 360 | (tana.jones@enron.com) | 0.016785 |
| 361 | (sara.shackleton@enron.com) | 0.012619 |
| 125 | (gerald.nemec@enron.com) | 0.011403 |
| 2288 | (kenneth.lay@enron.com) | 0.010187 |
| 43 | (john.lavorato@enron.com) | 0.010078 |
| 271 | (shelley.corman@enron.com) | 0.009883 |
| 72 | (steven.kean@enron.com) | 0.009833 |
| 180 | (jeff.skilling@enron.com) | 0.009303 |
| 3742 | (michelle.cash@enron.com) | 0.009082 |
| 1064 | (chris.germany@enron.com) | 0.008882 |
| 200 | (rod.hayslett@enron.com) | 0.008695 |
Email_Centrality['Degree_Centrality'] = Email_Centrality[['in_degree', 'out_degree']].sum(axis=1)
Email_Centrality['Diff_Degree_Centrality'] = Email_Centrality['in_degree'].subtract(Email_Centrality['out_degree'])
email_cent_corr = Email_Centrality.corr()
sns.set()
f, ax = plt.subplots(figsize=(20, 20))
c_corr = sns.heatmap(email_cent_corr, annot=True, linewidths=.5, ax=ax, cmap= 'coolwarm')
c_corr.savefig("c_corr.png")
c_corr
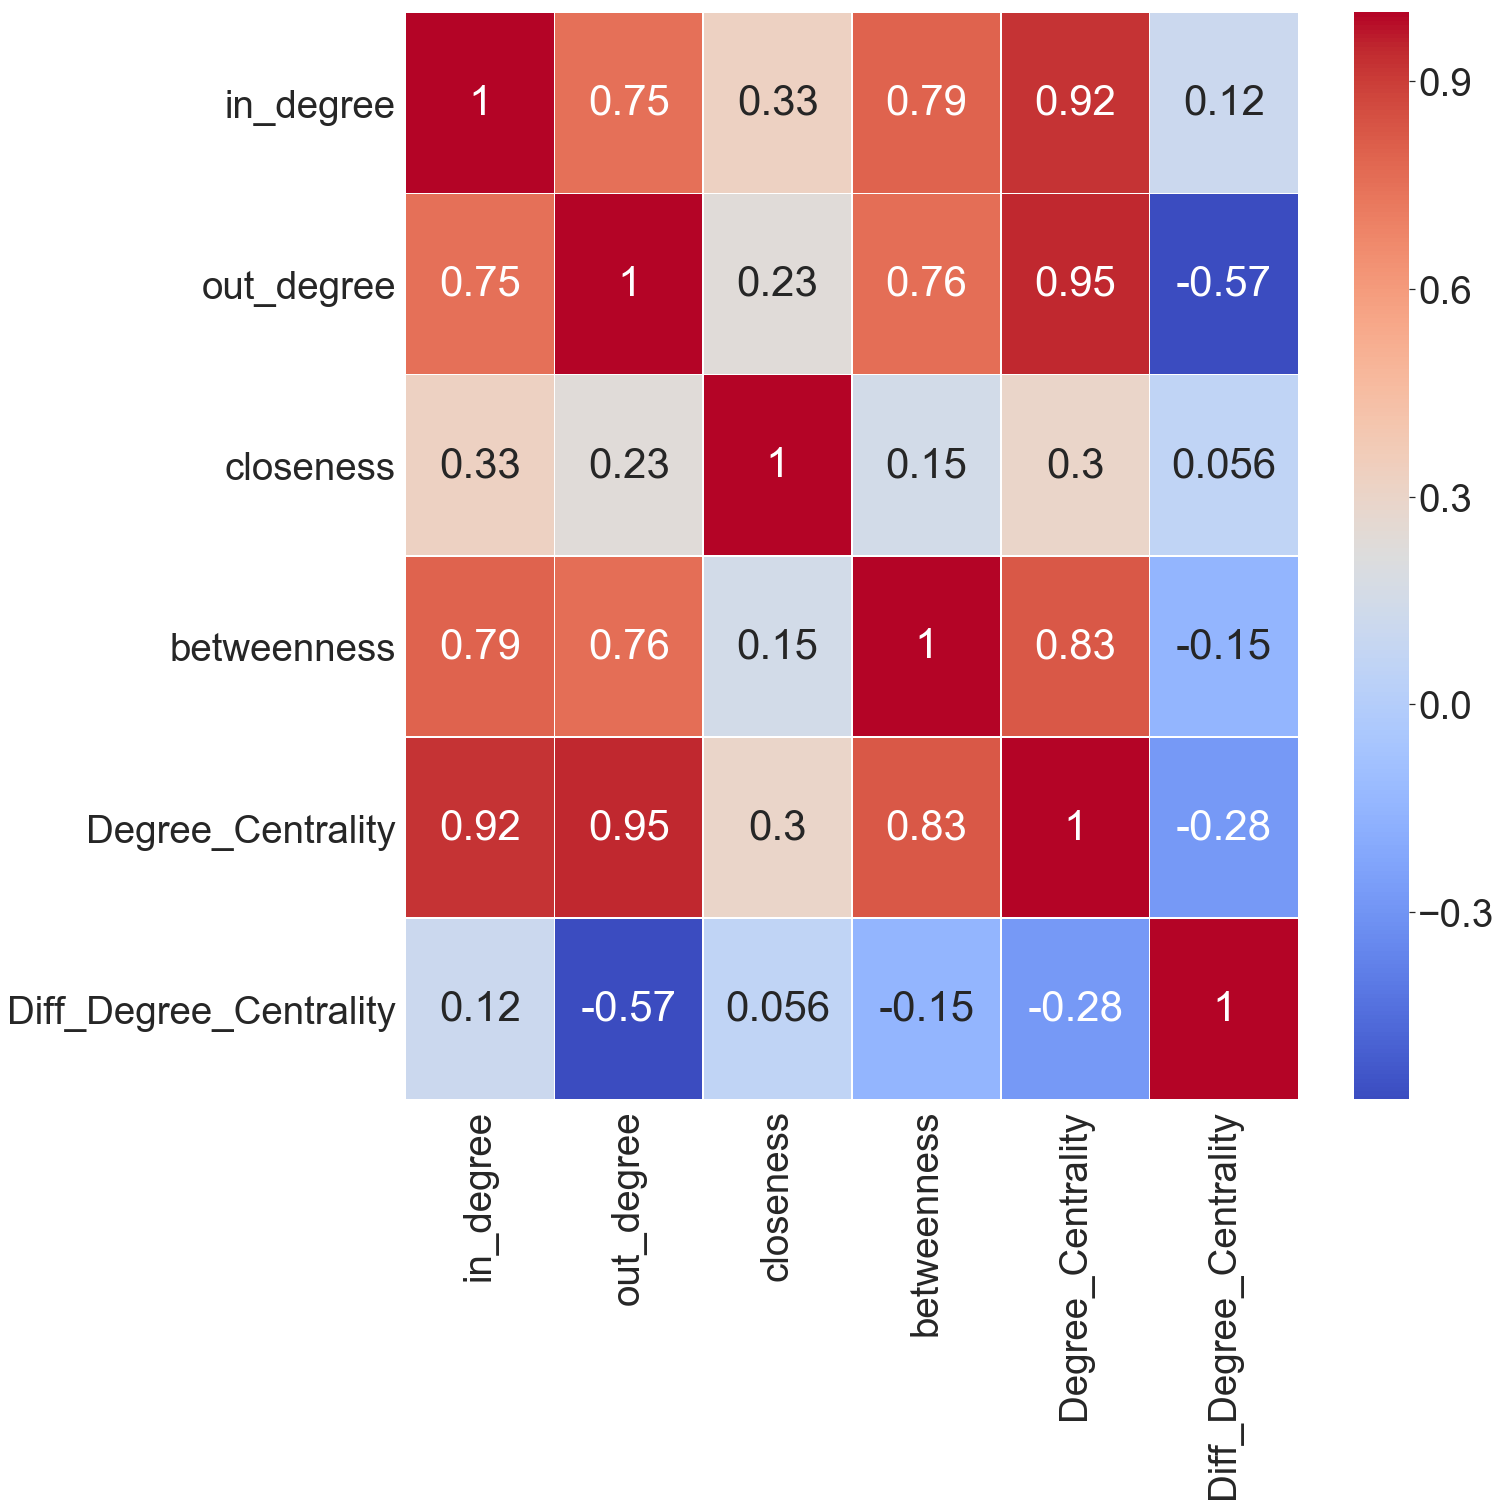
In and out degree centrality were sharply contrasted in some key people like Jeff Skilling and Kenneth Lay. Because of this, I decided to make another measure of difference degree centrality. This was the only centrality indicator that put Skilling, Lay, Whalley, Lavorato, and Kitchen all at the top of the hierarchy. It is possible that executive and management positions receive communication from many sources but only send emails to a select few executives who delegate down the hierarchy. It is also possible that emails they sent were not included in the public data set for legal reasons.
In the heat map above we use the Pearson correlation and can see that most of the centrality measures are positively correlated. Closeness centrality less so with the others and difference of degree centrality has no correlation with the others except for a negative correlation with out degree which is expected.
#Rank of Centrality 1 most central to N least central
centrality_rank = Email_Centrality\
.rank(axis='index', numeric_only=True, ascending=False)
centrality_rank['Emails'] = Email_Centrality['Emails']
centrality_rank = centrality_rank[['Emails', 'in_degree', 'out_degree', 'closeness',
                                   'betweenness', 'Degree_Centrality', 'Diff_Degree_Centrality']]
centrality_rank['median_rank'] = centrality_rank[['in_degree', 'out_degree', 'closeness',
                                   'betweenness', 'Degree_Centrality', 'Diff_Degree_Centrality']].median(axis=1)
email_cent_corr = centrality_rank.corr('spearman')
sns.set()
f, ax = plt.subplots(figsize=(20, 20))
rank_corr = sns.heatmap(email_cent_corr, annot=True, linewidths=.5, ax=ax, cmap= 'coolwarm')
rank_corr.savefig("rank_corr.png")
rank_corr
![]()
In the heat map above we use the Spearman correlation and see that most of the centrality ranks are highly correlated. Naturally, difference degree centrality is negatively correlated because it is the in degree minus the out degree. The Spearman correlation is used because using centrality indicators as measures of hierarchy we expect them to be monotonic.
Below, ordered by median rank, we can see how many of the ranks differ. but many of the names of Enron executives that we were looking for are present. From looking at the most central emails we can see that many of our centrality indicators are a good measure of hierarchy within the social network.
centrality_rank.sort_values(by=['median_rank'], ascending=[True]).head(15)
| Emails | in_degree | out_degree | closeness | betweenness | Degree_Centrality | Diff_Degree_Centrality | median_rank | |
|---|---|---|---|---|---|---|---|---|
| 443 | (louise.kitchen@enron.com) | 1.0 | 6.0 | 1.0 | 2.0 | 2.0 | 5.0 | 2.00 |
| 6 | (sally.beck@enron.com) | 2.0 | 4.0 | 4.0 | 1.0 | 3.0 | 2478.0 | 3.50 |
| 360 | (tana.jones@enron.com) | 4.0 | 2.0 | 12.0 | 5.0 | 1.0 | 16240.0 | 4.50 |
| 43 | (john.lavorato@enron.com) | 3.0 | 20.5 | 2.0 | 9.0 | 7.0 | 4.0 | 5.50 |
| 361 | (sara.shackleton@enron.com) | 5.0 | 3.0 | 29.0 | 6.0 | 5.0 | 16175.5 | 5.50 |
| 444 | (vince.kaminski@enron.com) | 10.0 | 5.0 | 8.0 | 4.0 | 6.0 | 16161.0 | 7.00 |
| 2288 | (kenneth.lay@enron.com) | 6.0 | 1781.0 | 5.0 | 8.0 | 26.0 | 1.0 | 7.00 |
| 81 | (jeff.dasovich@enron.com) | 12.0 | 1.0 | 37.0 | 3.0 | 4.0 | 16255.0 | 8.00 |
| 180 | (jeff.skilling@enron.com) | 7.0 | 751.5 | 9.0 | 12.0 | 29.0 | 2.0 | 10.50 |
| 125 | (gerald.nemec@enron.com) | 13.0 | 9.0 | 87.0 | 7.0 | 9.0 | 15924.0 | 11.00 |
| 72 | (steven.kean@enron.com) | 11.0 | 17.0 | 6.0 | 11.0 | 10.0 | 41.5 | 11.00 |
| 515 | (mark.taylor@enron.com) | 9.0 | 11.0 | 11.0 | 17.0 | 8.0 | 454.0 | 11.00 |
| 392 | (greg.whalley@enron.com) | 8.0 | 240.0 | 3.0 | 39.0 | 22.5 | 3.0 | 15.25 |
| 3742 | (michelle.cash@enron.com) | 24.0 | 12.0 | 28.0 | 13.0 | 13.0 | 16218.0 | 18.50 |
| 1064 | (chris.germany@enron.com) | 25.0 | 7.0 | 179.0 | 14.0 | 11.0 | 16247.0 | 19.50 |
This is an interactive map showing the most central node and their arrangement in a force directed graph. Dark red are the most important nodes ranked. Ideally our highly ranked nodes would show up in the center of our graph.
Below difference degree centrality is a good example as nodes in the center are closer to dark red.
Here is a look at the force directed graph working through the iterations from the inital point that these nodes had when using the whole network. They are colored using difference degree centrality.
Term Frequency of Pronouns
We want to measure the term frequency of pronouns and compare them to the centrality difference between the Recipient (To) and the Sender (From). We expect that CDelta centrality will have a negative correlation with use of First Person Singular (FPS) pronouns as emails travel down the hierarchy (for instance for people ranked 1 emailing someone ranked 30 CDelta = 29) and a positive correlation with the use of First Person Plural (FPP) pronouns for emails traveling down the hierarchy.
Let CDelta = CrankTo - CrankFrom
then as CDelta->-infty will TF(FPS)->0 and as CDelta->infty will TF(FPP)->1
Our hypotheses:
Hnull: Corr(CDelta, TF(FPS)) = 0 and Corr(CDelta, TF(FPP)) = 0
Halternative: Corr(CDelta, TF(FPS)) <= -0.1 and/or Corr(CDelta, TF(FPP)) >= 0.1
edge_content = email_exchanges.groupby(['From', 'To'])['content'].apply(lambda x: x.str.cat(sep=' ')).reset_index()
edge_content.head(10) #concatination of all emails between two nodes
| From | To | content | |
|---|---|---|---|
| 0 | (phillip.allen@enron.com) | (tim.belden@enron.com) | Here is our forecast Tim Matt sent you a emai... |
| 1 | (phillip.allen@enron.com) | (brent.price@enron.com) | Will Here is a list of the top items we need... |
| 2 | (phillip.allen@enron.com) | (steve.jackson@enron.com) | Will Here is a list of the top items we need... |
| 3 | (phillip.allen@enron.com) | (jeffrey.gossett@enron.com) | Susan hours are out of hand We need to find a... |
| 4 | (phillip.allen@enron.com) | (thomas.martin@enron.com) | attached is the systems wish list for the gas ... |
| 5 | (phillip.allen@enron.com) | (sally.beck@enron.com) | Susan hours are out of hand We need to find a... |
| 6 | (phillip.allen@enron.com) | (susan.mara@enron.com) | Attached are two files that illustrate the fo... |
| 7 | (phillip.allen@enron.com) | (john.arnold@enron.com) | attached is the systems wish list for the gas ... |
| 8 | (phillip.allen@enron.com) | (matt.smith@enron.com) | Can you guys coordinate to make sure someone l... |
| 9 | (phillip.allen@enron.com) | (rebecca.cantrell@enron.com) | Attached are two files that illustrate the fo... |
FPS First Person Singular
SPS Second Person Singular
TPS Third Person Singular
its it its itself
FPP First Person Plural
TPP Third Person Plural
def words_tf(words, string):
    "finds the term frequency of a given list of pronouns"
    text = nltk.word_tokenize(string)
    g = 0
    for word in words:
        g+=float(text.count(word))
        if len(text)>0:
            return g / len(text)
        else:
            return 0
#spearman correlation as we are denoting a hierarchy centrality is monotonic
ghen_corr=ghen.corr('spearman')
sub_corr = ghen_corr[['FPS', 'SPS', 'TPS', 'its', 'FPP', 'TPP']]
sns.set()
f, ax = plt.subplots(figsize=(20, 20))
em_corr=sns.heatmap(sub_corr, annot=True, linewidths=.5, ax=ax, cmap='coolwarm')
em_corr.savefig("all_email_corr.png")
em_corr
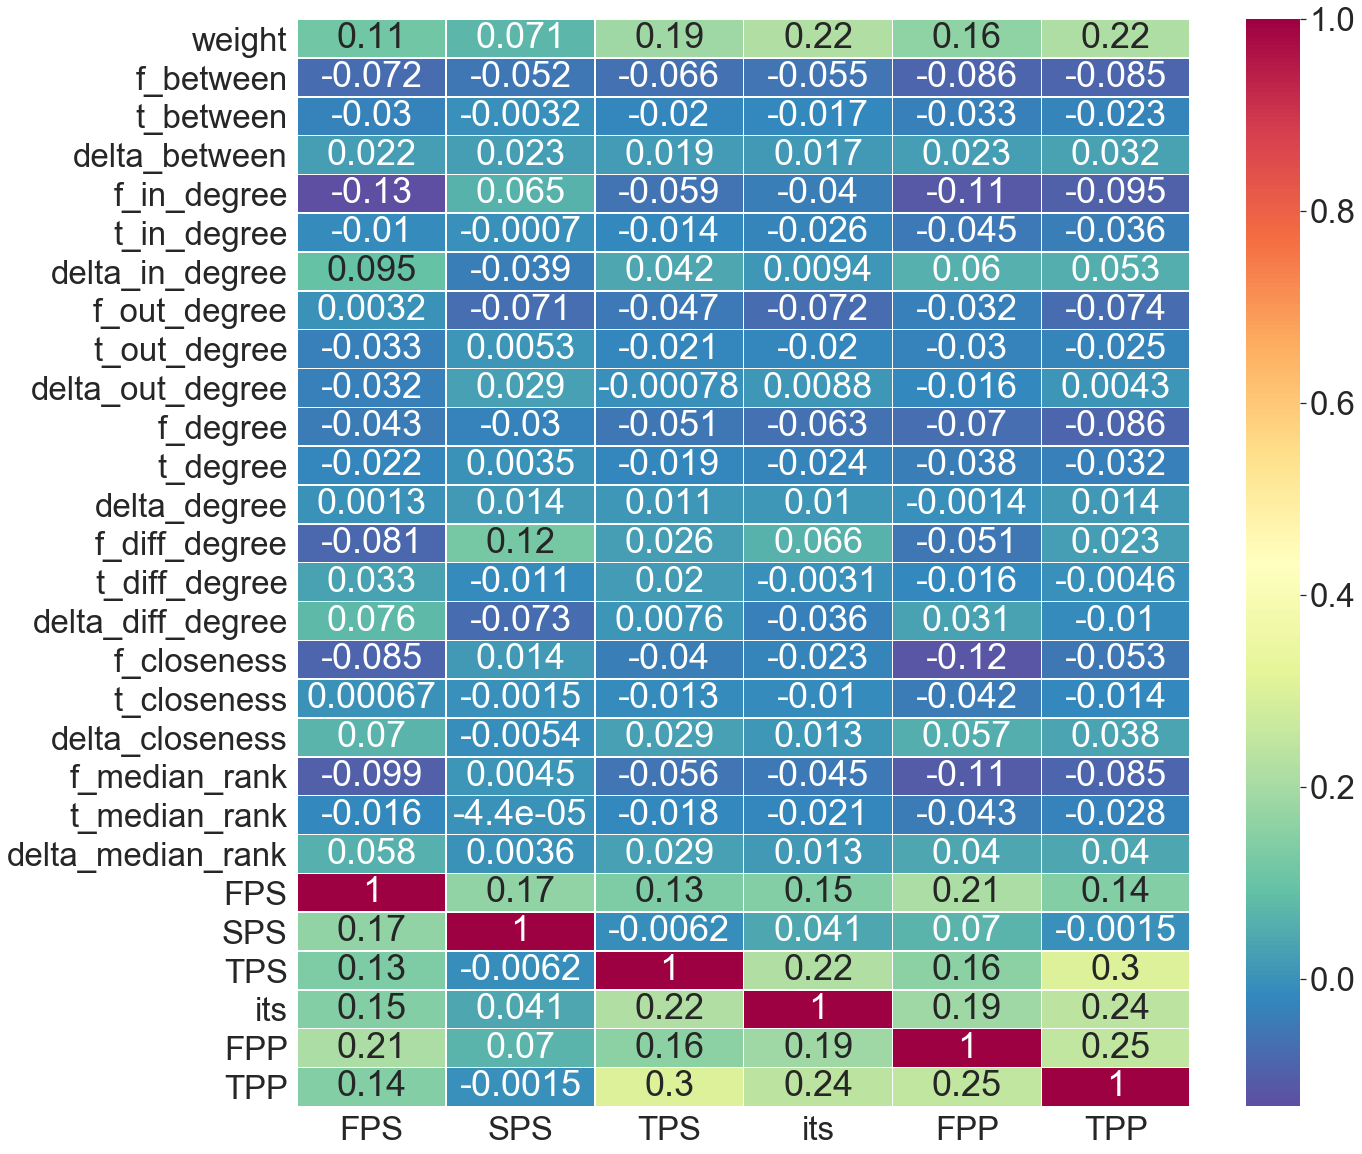
The correlation matix above does not find an effect above our + or - 0.1 threshold between various delta centralities and pronoun types.
There are correlations between the from centrality and pronouns types for instance highly ranked employees by in_degree were significantly less likely to use First Person Singular (FPS) pronouns (rs=-0.13) and also less likely to use First Person Plural (FPP) pronouns (rs=-0.11). This is interesting as it is at least partial evidence for Pennebakers hypothesis that high-status individuals use less FPS pronouns than low-status individuals. It is also evidence against his finding that high-status individuals use more FPP pronouns.
Difference degree centrality of from nodes also found that higher-status individuals were more likely to use Second Person Singular (SPS) pronouns (rs=0.12). This means that when sending emails these people were more likely to be using imperative sentences. Difference degree centrality was a measure of the difference between in and out connected nodes which means these individuals had many different people email them than they emailed themselves. This was a good indication of the top two executives Skilling and Lay. The correlation could signal that when these nodes sent emails were more likely to be commands.
One to One Correspondences (N recipients=1)
Emails sent to more than one recipient may cause senders to use pronouns differently. Below we do the same analysis correspondents that include only one to one correspondences.
# edge content with 1 recipient
edge_content = email_exchanges.loc[email_exchanges['n_recipients']<2].groupby(['From', 'To'])['content'].apply(lambda x: x.str.cat(sep=' ')).reset_index()
edge_content.head(10)
| From | To | content | |
|---|---|---|---|
| 0 | (phillip.allen@enron.com) | (tim.belden@enron.com) | Here is our forecast Tim Matt sent you a emai... |
| 1 | (phillip.allen@enron.com) | (chad.landry@enron.com) | Chad Call Ted Bland about the trading track p... |
| 2 | (phillip.allen@enron.com) | (karen.buckley@enron.com) | I think Chad deserves an interview The topic w... |
| 3 | (phillip.allen@enron.com) | (andrea.richards@enron.com) | Send his resume to Karen Buckley I believe th... |
| 4 | (phillip.allen@enron.com) | (naomi.johnston@enron.com) | Naomi The two analysts that I have had contac... |
| 5 | (phillip.allen@enron.com) | (mary.gray@enron.com) | Griff It is bidweek again I need to provide ... |
| 6 | (phillip.allen@enron.com) | (brenda.flores-cuellar@enron.com) | JeffBrenda Please authorize the following pro... |
| 7 | (phillip.allen@enron.com) | (slewis2@enron.com) | Susan I received an enrollment confirmation ... |
| 8 | (phillip.allen@enron.com) | (candace.womack@enron.com) | vishal resigned today |
| 9 | (phillip.allen@enron.com) | (julie.gomez@enron.com) | here is the file I showed you Julie The numb... |
#Spearman Corr
ghen_corr=ghen.corr('spearman')
sub_corr = ghen_corr[['FPS', 'SPS', 'TPS', 'its', 'FPP', 'TPP']]
sns.set()
f, ax = plt.subplots(figsize=(20, 20))
em_corr=sns.heatmap(sub_corr, annot=True, linewidths=.5, ax=ax, cmap='coolwarm')
em_corr.savefig("private_email_corr.png")
em_corr
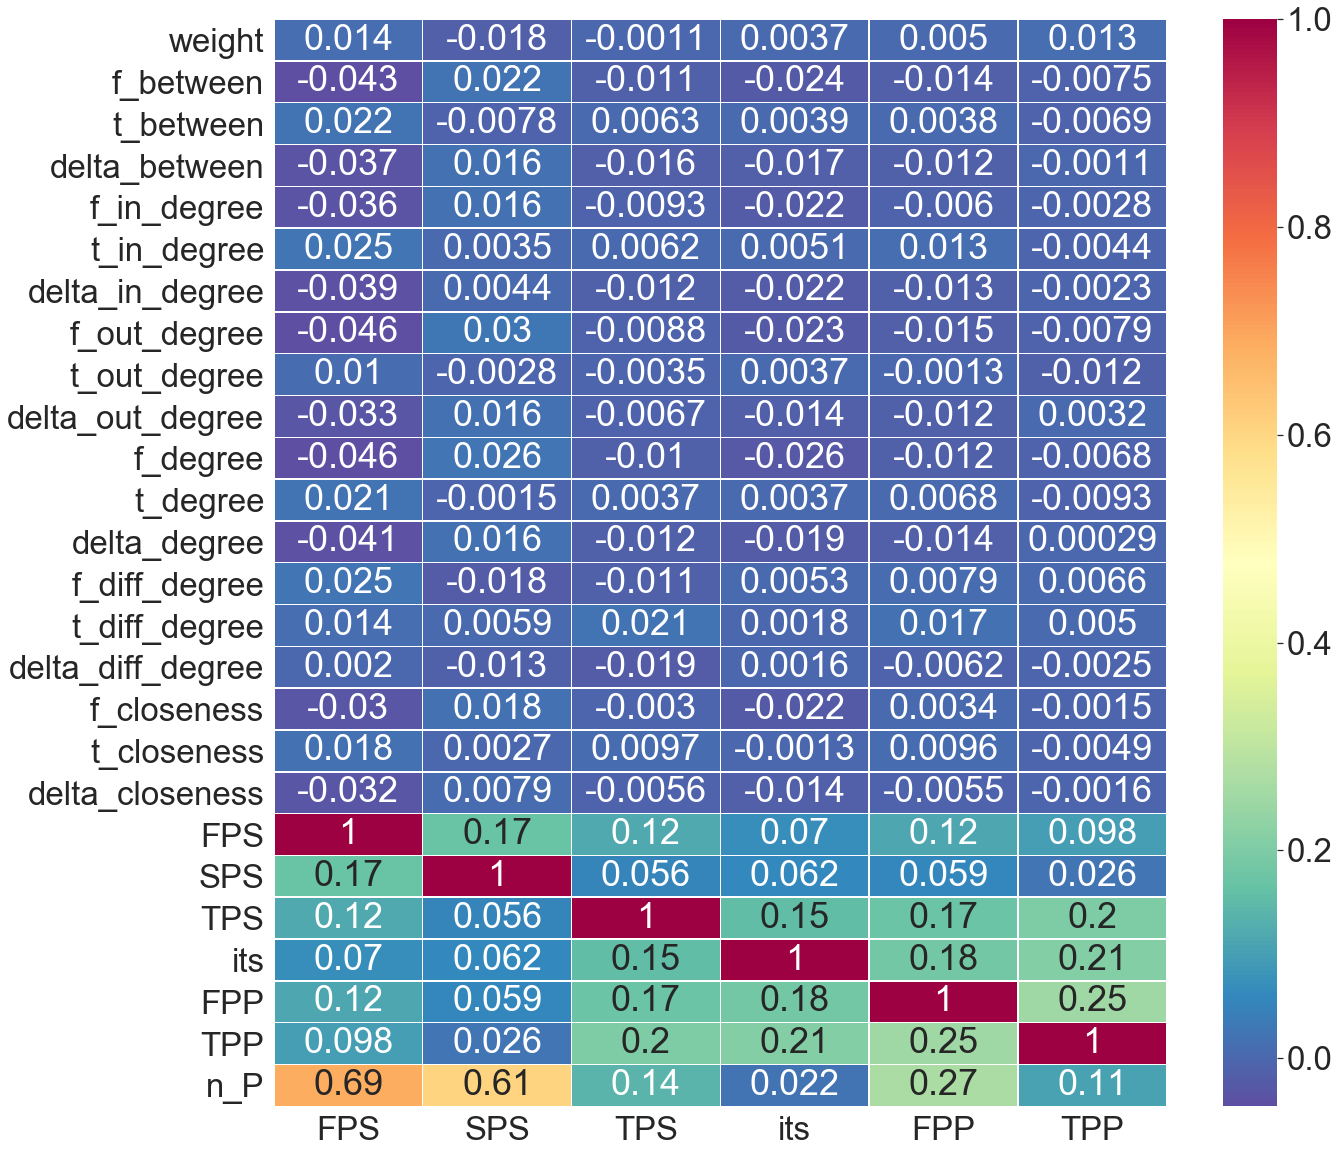
There were no findings here to indicate a relationship between centrality and pronoun usage. This could because one to one emails were more likely to happend between equals and so power dynamics were less of a factor.
Conclusion
These tests find little to no correlation between the term frequency of pronoun categories and social status dynamic between the sender and reciever of emails. Some of the findings do confirm some of Pennebaker’s findings. Notably, in degree centrality and difference degree centrality showed evidence of power dynamics at play in the intra-Enron social network. High-status individuals measured by in degree were less likely to use first person singular pronouns as well as first person plural pronouns. High-status difference degree were measured to use more second person pronouns perhaps indicating more imperative sentences. The findings both support and go contrary to those in Pennebaker’s Paper.
The dynamic that Pennebaker proposed did not manifest itself in communication between nodes. The corrleation between pronoun usage and the difference of centrality were close to zero (-0.1<rs<0.1)
The centrality measures above did rank top executives highly but it was not clear that it continued to be predictive for email accounts with lower centrality. The centrality measures might not capture nodes of equal rank. After the top eschelon of Enron nodes would start to have many more equals than subordinates or superiours and would communicate on this basis. The centrality rank would not reflect this.
Using the communications of a social network to map the social hierarchy is problematic. Some roles may require a disproportionate representation in the communication network. Secretaries of executives might rank higher than upper level management because of their position as an intermediary. These caveats should be taken into account when considering the findings.
The full notebook including data cleaning and preprocessing analysis can be viewed here and the full network analysis can be viewed here.